
Indicator Gauge Icon Legend
Legend Colors
Red is bad, green is good, blue is not statistically different/neutral.
Compared to Distribution
 the value is in the best half of communities.
 the value is in the 2nd worst quarter of communities.
 the value is in the worst quarter of communities.
Compared to Target
 meets target;
  does not meet target.
Compared to a Single Value
 lower than the comparison value;
 higher than the comparison value;
 not statistically different from comparison value.
Trend

 non-significant change over time;
 significant change over time;
  no change over time.
Compared to Prior Value
 higher than the previous measurement period;
 lower than the previous measurement period;
 no statistically different change from previous measurement period.
 Significantly better than the overall value
 Significantly worse than the overall value
 No significant difference with the overall value
 No data on significance available
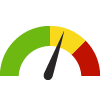
Percent of Delinquency Referrals that were Bomb Threats
Measurement Period: 2012-2016
This indicator is archived and is no longer being updated. Click to learn more
Why is this important?
From 2012 through 2016, while the total number of delinquency referrals remained stable, there was an alarming rise in delinquency referrals for youth ages 12 and under. These pre-teen youth accounted for 21% of all delinquency referrals during that 5-year span. These referrals often resulted from a youth’s aggressive behavior stemming from mental health-related issues which required law enforcement intervention to safely resolve. In Wisconsin, 17-year-olds are subject to the adult criminal justice system. There continues to be a national movement for states to raise this age limit based on research on human brain development and other factors.
1.0%
percent %
Source:
Portage County Health and Human Services
Measurement period: 2012-2016
Maintained by: United Way of Portage County
Last update: May 2023
Measurement period: 2012-2016
Maintained by: United Way of Portage County
Last update: May 2023
Compared to
Graph Selections

Data Source
- Portage County Health and Human Services
Maintained By: United Way of Portage County
Filed under: Community / Crime & Crime Prevention, Health Behaviors, Children, Teens